VigeneTech offers a free trial. Please Contact us to obtain the license required for image analysis.
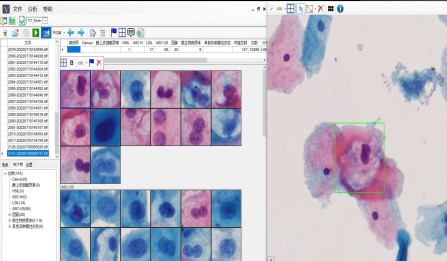
Highly automated image analysis software for cell-based images with multi-signal segmentation support. Clinical diagnostic software for cell and tissue image analysis delivering accurate, sensitive, reliable results with unprecedented automation and high performance.

Feature 01
CellVigene™ is purpose-built for tissue microarray and cell-based image analysis: it automatically aligns hundreds of cores, quantifies signal intensity and positive area at cell-level precision, and outputs directly comparable statistical matrices—taking TMA research from visual scoring to quantitative data.
Feature 02
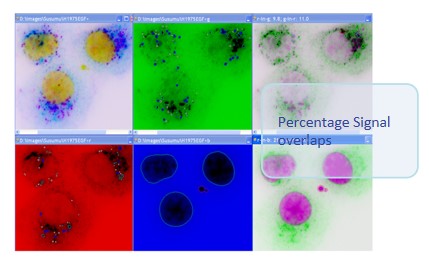
CellVigene™ is purpose-built for tissue microarray and cell-based image analysis: it automatically aligns hundreds of cores, quantifies signal intensity and positive area at cell-level precision, and outputs directly comparable statistical matrices—taking TMA research from visual scoring to quantitative data.
Feature 03
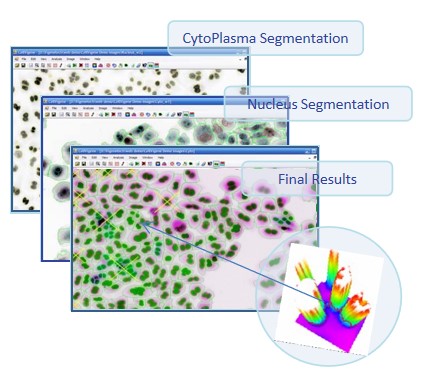
Cell-based micronucleus assay: detects small/weak micronuclei next to large/strong nuclei
Feature 04
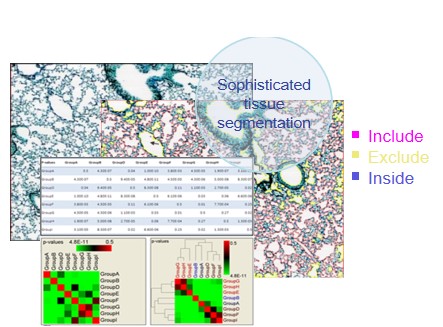
CellVigene™ is purpose-built for tissue microarray and cell-based image analysis: it automatically aligns hundreds of cores, quantifies signal intensity and positive area at cell-level precision, and outputs directly comparable statistical matrices—taking TMA research from visual scoring to quantitative data.
Feature 05
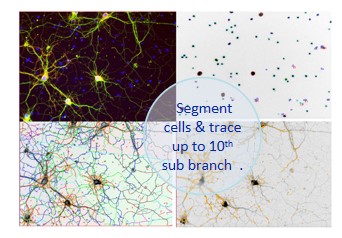
CellVigene™ is purpose-built for tissue microarray and cell-based image analysis: it automatically aligns hundreds of cores, quantifies signal intensity and positive area at cell-level precision, and outputs directly comparable statistical matrices—taking TMA research from visual scoring to quantitative data.
Feature 06
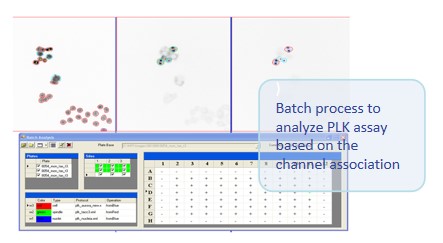
CellVigene™ is purpose-built for tissue microarray and cell-based image analysis: it automatically aligns hundreds of cores, quantifies signal intensity and positive area at cell-level precision, and outputs directly comparable statistical matrices—taking TMA research from visual scoring to quantitative data.
Core capabilities
Automatic core detection
Automatically locates every core on the tissue microarray and aligns them to the grid, with manual fine-tuning to guarantee accuracy.
Cell-level analysis
Identifies tissue, cells and marker signals at the single-cell scale, avoiding information loss from regional averaging.
Intensity & area quantification
Extracts signal intensity, positive area and percentage at pixel level, outputting per-core and per-population statistics.
Batch statistical comparison
One-click batch analysis of hundreds of cores on a full slide, with matrix output ready for group comparison and publication.
Workflow
01
Load image
Import tissue microarray scans in common pathology formats.
02
Core alignment
Auto-detect the core grid and align cores, with manual correction on demand.
03
Cell-level analysis
Segment tissue at the cell scale and extract signal intensity and area.
04
Quantitative report
Output statistical matrices and visual reports ready for comparison and publication.
Use cases
| Scenario | Capability | Typical output |
|---|---|---|
| TMA screening | Batch quantification and comparison of cores across large cohorts | Core statistics matrix |
| IHC quantification | Automated quantification of IHC signal intensity and positivity | H-score / positivity rate |
| Fluorescence analysis | Cell-level colocalization of multicolor fluorescence signals | Colocalization statistics |
| Drug target expression | Cohort comparison of target protein expression levels | Inter-group expression differences |
Contact us for a CellVigene™ demo and experience cell-level quantitative analysis of tissue microarrays.